
Yanhua Zhang
Ye Tian
Sihui Ding
Sihui Ding
Yi Lv
Wagle Samjhana
Wagle Samjhana
Shengzuo Fang
Shengzuo Fang
College of Forestry, Nanjing Forestry University, Nanjing 210037, ChinaCo-Innovation Center for Sustainable Forestry in Southern China, Nanjing Forestry University, Nanjing 210037, China
Author to whom correspondence should be addressed. Forests 2020, 11(8), 842; https://doi.org/10.3390/f11080842Submission received: 6 July 2020 / Revised: 19 July 2020 / Accepted: 31 July 2020 / Published: 3 August 2020
Poplar, as the most widely cultivated fast-growing tree species in the middle latitude plain, provides important wood resources and plays an important role in mitigating climate change. In order to understand the response of growth, biomass production, carbon storage to poplar clones, planting spacings, and their interaction, a field trial was established in 2007. In 2018, we destructively harvested 24 sample trees for biomass measurements and stem analyses. Biomass production and carbon storage for the single tree of three clones enhanced as planting spacing increasing at the age of 13, but both the biomass production and carbon storage of clones NL-895 and NL-95 were higher than the clone NL-797 at the spacings of 6 × 6 m and 5 × 5 m. The average carbon concentration of the tested clones was in the order of stem > branches > leaves, and showed significant variation between different components ( p < 0.05). Large spacing stimulated more biomass to be partitioned to the canopy. Based on the prediction values of tree volume growth by established Chapman–Richards models, the quantitative maturity ages of stand volume varied among the investigating plantations, ranging from 14 to 17 years old. Our results suggest that the selecting clones NL-895 and NL-95 with 6 × 6 m spacing would be recommended at similar sites for future poplar silviculture of larger diameter timber production, as well as for carbon sequestration.
As reported, planted forest area accounts for about 7% of the total forest area, but the industrial roundwood production from plantations represented 33.4% of global production from all types of forest [1]. Therefore, planted forests play an important role in the global and regional economies to secure industrial roundwood and wood fuel, and to mitigate climate change [1,2]. China owns the largest plantation area in the world, accounting for 24.82% of the global plantation areas [2,3,4,5]. The continuous increase of plantation area contributes significantly to the forest coverage of China, but the yield and quality in the plantations are not high in general, and the forest stock per hectare is only 69% of the world average level of 131 m 3 [3]. Poplar plantations are no exception, although they play an important role in sustaining the commercial supply of forest products and fixing atmospheric CO2 [6]. With the development of the economy, timber consumption level has increased dramatically in China. In 2018, China imported about 127.61 M m 3 of major forest products, including logs, sawn timber, and wood pulp, totaling 47.01 billion dollars [4].
Regarding the observed increase in the atmospheric concentration of CO2 and the global climate problems, one main option is to increase forest biomass for reducing the volume of atmospheric CO2, which can be achieved by planting currently unforested land, or by improving the productivity of existing forests. Poplar, as one of the most widely cultivated timber and ecological commonweal tree species in the middle latitude plain of the world, has the characteristics of being fast-growing and having large biomass, diverse uses, and easy adaptability [7]. By 2015, China’s poplar plantation area reached 8.54 M ha, accounting for 12.32% of the national plantation area [3]. Considering the huge carbon storage and the interest of the forest industry in poplar plantations, any fluctuations in their productivity could have major ecological and economic consequences. Also, in fast-growing, short rotation plantations, nutrient accumulation and export from the site has been considered for a long time, as nutrients are removed through frequent harvests [8,9]. Present studies have shown that poplar growth does not only depend on the growing season length [10], but also on the genotype [11,12], planting density [13,14], site conditions [15,16,17], and management strategies applied [18,19,20]. In practice, genotype and planting spacing as the most easily controlled factors are very important in the directional cultivation of plantations [21]. Choice of the best spacing system is closely related to the maximum production of biomass production, biomass partitioning, nutrient accumulation, and determination of duration of production cycle. Generally, the diameter and aboveground biomass of a single tree increases with increasing planting spacing [13,22], while the greatest biomass productivity has been achieved in higher density stands [14,23]. Meanwhile, the selection of a poplar genotype is critical to improving yield and productivity levels [9,11,12]; the crown ratio, branches traits, biomass allocated of the stem were also affected by cloning and spacing [13,23]. Fang et al. [23] evaluated growth dynamics, biomass production, and carbon storage in short-rotation poplar plantations, with four planting spacings (3 × 3 m, 3 × 4 m, 4 × 4 m. and 4 × 5 m) and three poplar clones (NL-80351, I-69, and I-72), but optimal rotation was not reported for the investigated plantations. Therefore, attempts were made in this study to understand the influence of new genotypes and planting spacings on the growth, aboveground biomass production and partitioning, carbon storage, and rotation length of poplar plantations, which can provide some references for optimizing the cultivation patterns at similar sites.
The site is located in the Sihong forest farm, Jiangsu Province, China (33°16′ N, 118°18′ E). In this region, there is a mid-latitude climate, with a mean annual air temperature of 14.84 °C, while the mean temperatures is 27.4 °C in July and −7 °C in January, respectively [24]. The mean annual sunshine hour is between 2250 and 2350 h, and the mean annual precipitation is about 1000 mm, occurring mostly from June to August each year. Soils at this site were formed on fine sediments of Hongze Lake. The basic physical and chemical properties at the trial site are relatively consistent, with clay loam texture and middle soil fertility [24].
The experimental design consisted of a randomized, complete block with three replications, and the plantations were established in March 2007 with one-year-old rooted cutting of three poplar clone seedlings, including Nanlin-895 (NL-895), Nanlin-95 (NL-95), and Nanlin-797 (NL-797), a hybrid of clone I-69 ( Populus deltoides Bartr. cv. “Lux”) × clone I-45 ( P. × euramericana (Dode) Guinier cv. I-45/51′). Planting spacing designs included two squares (6 × 6 m and 5 × 5 m) and two rectangles (4.5 × 8 m and 3.5 × 8 m). In total, 36 plots were randomly arranged and established, with each plot about 1200–1800 m 2 (50 trees per plot). However, in this study, we only choose two spacings (6 × 6 m and 5 × 5 m) of clones NL-95 and NL-797 and four spacings of clone NL-895 for detailed biomass investigation and stem analysis, so in total 24 plots were selected.
In early October 2018, twelve years following the plantation’s establishment, the diameter at breast height (1.3 m height above ground, DBH in cm) and tree height ( H in m) of all trees were measured at each plot. For the biomass measurement, one tree (selected on the basis of mean diameter) was identified and harvested for destructive sampling in the selected plots, and in total 24 sample trees were harvested. Trees were cut at ground level and felled onto a large canvas. Each sample tree was divided into three components—stem, branches, and leaves—and fresh weights of all components were determined in the field; sub-samples were collected for moisture and carbon (C) analysis. The fresh biomass of branches and leaves were sampled and recorded in a stratified manner, where the lower, middle, and upper layers of the tree canopy were divided by equal canopy height. Both woody and non-woody biomass were dried to a constant weight at 60 °C.
Stems were cut at 1.3 m and 3.6 m, and then cut into 2 m long segments in this experiment, and stem samples (stemwood + stembark) were obtained from disks cut at 1.3 m (breast height), 5.6 m, 11.6 m, and 17.6 m (nearly 25%, 50%, and 75% of the total height, respectively) for each sample tree. Total stem biomass was obtained by summing the values for all bolts of each sample tree, while the total aboveground biomass of the sample tree was estimated by summing the values for all components of each sample tree.
Stem analysis was conducted to estimate tree growth dynamics in different treatments, and a total of 24 sample trees were harvested for stem analysis. Tree height was measured again after harvest by the clinometer. A stem disc was taken from each section (0 m, 1.3 m, 3.6 m, 5.6 m, etc.) for analysis of the number and width of tree rings. The wood discs were polished to increase visualization of growth rings [25,26]. North–south and east–west transects were selected from the center of the disc to the edges of the stem and marked with permanent marker, and the number of rings were counted and then averaged for each stem. The number of tree rings of the base discs of the stem analysis trees were counted and compared with the documented age of plantations, in order to validate estimations of tree age based on annual tree rings. Comparison of the number of tree rings between stem discs at different tree heights was used to estimate tree height growth over tree ages.
The tree volume was estimated according to following formula (1) [27]: v = 2.6 · π · d 1 2 4 + 2 · π · d 2 2 + d 3 2 + ⋯ + d n − 1 2 4 + h t o p · π 3 · d n 2 4in which 2.6 and 2 are height of the bolts; d 1 is the diameter at 1.3 m, marked number 1; d 2, …, d n −1 are the cross-sectional diameters at every tree height where discs were cut, except for number 1 and the top disc; dn is diameter of the top disc cut from the stem analysis tree; and htop is height of the top section (the cone section from the last disc to the top of the tree) of the stem analysis tree.
In order to select the most suitable, nonlinear model for fitting and accurately evaluating the growth dynamics of DBH , H , and tree volume, seven theoretical functions (Table 1) that are widely used in forestry modeling were evaluated based on the data obtained from stem analysis.
Matlab2014a (Math Works Inc., Natick, MA, USA) was used to calculate nonlinear regression, and the coefficient of determination ( R 2 ), residual sum of squares (RSOS), root mean square error (RMSE), and Akaike’s information criterion (AICc) were calculated simultaneously (Table S1) [28]. Since the models are nonlinear, it is helpful to use RMSE and RSOS as a measure of accuracy, together with R 2 . Since the models we test vary from one to four parameter models, the AICc is an important measurement for comparison and model evaluation. In addition, growth dynamics of the poplar plantations generally followed the three growth stages of “slow–fast–slow”. Then, seven models were respectively used to take the second derivative of poplar volume to get X 1 and X 3, and the third derivative to get X 2 (the year with the highest periodic annual increment (PAI)); these represent the three turning points of poplar growth. Meanwhile, we calculated the second and third derivatives of the smoothed curve of the stem analysis measurement value, and also got three growth turning points. Finally, we compared these three growth turning points of seven models with the measurement curve (Table S2), and the best growth model was selected to evaluate the tree growth dynamics, based on the lowest error and best biologically meaning.

Table 1. Seven theoretical functions used to fit the diameter at breast height ( DBH ), tree height ( H ), and tree volume growth in the study.
Table 1. Seven theoretical functions used to fit the diameter at breast height ( DBH ), tree height ( H ), and tree volume growth in the study.
| NO. | Function Name | K * | Function * | Reference |
|---|---|---|---|---|
| 1 | Mitscherlich | 2 | Y ( t ) = a [ 1 − exp ( − a t ) ] | Li et al. [29] |
| 2 | Logistic | 3 | Y ( t ) = a / [ 1 + b exp ( − c t ) ] | Yoshimoto [30] |
| 3 | Gompertz | 3 | Y ( t ) = a exp [ − b exp ( − c t ) ] | Yoshimoto [30] |
| 4 | Johnson Schumacher | 3 | Y ( t ) = a exp [ − b / ( t + c ) ] | Fang et al. [31] |
| 5 | Korf | 3 | Y ( t ) = a exp [ − b t − c ] | Li et al. [29] |
| 6 | Chapman-Richards | 3 | Y ( t ) = a [ 1 − exp ( − b t ) c ] | Liu and Li [32] |
| 7 | Weibull | 4 | Y ( t ) = a [ 1 − b exp ( − c t d ) ] | Deng et al. [33] |
* K is the number of fixed model parameters; Y is the total tree DBH in cm, H in m, and volume in m 3 ; t is the tree age in years, and the fixed model parameters are a , b , and c .
The quantification of carbon storage aboveground of poplar trees was assessed using the samples collected in the destructive assessment. We collected seven samples for each sampling tree, including three leaf samples, three branch samples, and one stem sample, all collected at the tree height of 11.6 m, and a total 168 samples were collected for carbon concentration measurement. After measuring the water content, all samples were macerated in a pulverizer with a 270-mesh sieve, and then placed into sealed sacks. The carbon concentration was measured by using a universal Elementar analyzer (Vario micro cube, Germany). Samples with 0.5 mg were allocated into tin capsules and completely incinerated at 1200 °C [34]. The mean carbon storage of the sample tree for each treatment was calculated using three replications, and each sample tree was obtained from the biomass of each component (leaf, branch, and stem) and the average carbon concentrations in that component. The carbon storage was calculated using the mean carbon concentration of the sample trees for each treatment, multiplying it with their standing biomass per hectare.
Determining the optimal rotation age of the plantations is a key technique in plantation management practices. During this practice, the quantitative maturity age is mainly considered, where the periodic annual increment (PAI) is equal to mean annual increment (MAI) of the sample trees’ volume growth.
Data are reported as the mean ± standard error (SE), and all tests were statistically analyzed with the software Matlab2014a and SPSS19.0 (SPSS Inc., Chicago, IL, USA). One-way analysis of variance (ANOVA) was used to examine the significant differences in aboveground biomass, carbon storage of different clones, and planting spacings. We used Tukey tests to examine differences between means with significant results. Two-way ANOVA was performed to determine the significant dependence of DBH , H , and tree volume on clones, planting spacings, and their interactions. All statistical tests were considered significant at p < 0.05.
Significant ( p < 0.05) variations in DBH , H , tree volume, and stand volume were observed in the plantations at 13 years of age (Figure 1 and Table 2). DBH and H of clone NL-895 and the tree volume of clones NL-895 and NL-95 were shown to have significant differences between different planting spacings, while stand volume did not show any significant differences between planting spacings of the three clones. DBH , H , and the tree volume of clones were consistently higher in the large spacings (6 × 6 m and 4.5 × 8 m) than the narrow spacings (5 × 5 m and 3 × 8 m).
There was no significant interactive effect of clone and planting spacing over 13 years of poplar growth ( p > 0.05; Table 2). Stem analysis data showed that initially, clone and planting spacing did not show any significant effects on DBH , H , and tree volume; however, these parameters varied significantly with increasing age. Planting spacing showed a significant effect on DBH and tree volume growth after six and five growing seasons respectively, whereas no significant effects on tree height growth were detected in most cases (Table 2). However, both poplar clone and planting spacing showed a significant effect on tree volume after the six growing seasons.
There existed a significant difference in aboveground tree biomass between different spacings of clones NL-895 and NL-95 ( p < 0.05; Figure 2A). The higher tree biomass accumulated in the large spacings (6 × 6 m and 4.5 × 8 m) for each poplar clone; this biomass was 45.42~65.51% higher than that in the narrow spacings (5 × 5 m and 3 × 8 m). The aboveground biomass of clones NL-895, NL-95 and NL-797 were 344.18 kg tree −1 , 337.71 kg tree −1 , and 249.04 kg tree −1 in the 6 × 6 m spacing stand, which was 63.75%, 56.30%, and 24.85% higher than in the 5 × 5 m spacing, respectively. The aboveground biomass of NL-895 and NL-95 was 37.85% and 35.60% higher than NL-797 in the 6 × 6 m spacing stand ( p < 0.05), respectively, but no significant differences were observed between the three clones in the 5 × 5 m spacing stand, suggesting that the difference of aboveground biomass between three clones tend to be reduced as the planting spacing decreases.
The total aboveground biomass of clones NL-895, NL-95, and NL-797 were not significantly ( p > 0.05) influenced by planting spacing (Figure 2B). A significant variation in total aboveground biomass was observed among the three clones in the 6 × 6 m spacing stand ( p < 0.05), but not in the 5 × 5 m spacing stand ( p >0.05; Figure 2B). The total aboveground biomass production in the 6 × 6 m spacing stand reached 95.68 t ha −1 for NL-895, 93.88 t ha −1 for NL-95, and 69.23 t ha −1 for NL-797, respectively. Contrary to the clones NL-895 and NL-95, the total aboveground biomass of clone NL-797 in the 5 × 5 m spacing stand was higher than 6 × 6 m, indicating that the stem number of per hectare was the main driver of total aboveground biomass production in clone NL-797.
The partitioning of biomass in leaves, branches, and stems was also influenced by clone and planting spacing (Figure 2C). Most of the aboveground biomass was allocated to stem production, but more biomass was partitioned to canopy biomass (leaves and branches) in the 6 × 6 m spacing when compared to the 5 × 5 m. The percentage of canopy biomass averaged across three poplar clones was 12.88% greater in the 6 × 6 m spacing stand than the 5 × 5 m one, while the percentage of canopy biomass averaged between the 6 × 6 m and 5 × 5 m spacings for clones NL-895, NL-95, and NL-797 was 13.25%, 16.44%, and 17.25%, respectively.
As shown in Figure 3, poplar clones and planting spacings significantly affected the vertical biomass distribution in the canopy ( p < 0.05). The biomass of all tree components in 6 × 6 m and 4.5 × 8 m spacings was higher than that in the spacings of 5 × 5 m and 3 × 8 m in the same segment or canopy layer (Figure 3). For three clones, the greatest biomass of the branches was observed in the middle layer at any planting spacings, followed by the lower and upper layers (Figure 3E–H), while the biomass of the leaves was concentrated in the middle and upper layers (Figure 3I–L).
The average carbon concentration of the different components was in the order of stem (46.66%) > branch (46.34%) > leaf (40.96%) (Table 3). ANOVA revealed significant differences between the values of carbon concentration among these three components ( p < 0.05). However, the poplar clones and planting spacings did not significantly affect carbon concentrations in the branches, whereas the leaf carbon concentration in clone NL-797 was significantly higher than that in clone NL-895 (Table 3).
The carbon storage in the stems, branches, and leaves was 84.60%, 13.84%, and 1.56% at the stand age of 13 respectively, where the values were averaged in all treatments (Figure 4). However, there was a significant difference in aboveground carbon storage among the plantations of four planting spacings for NL-895 ( p < 0.05), and the highest carbon storage was obtained in the NL-895 plantation of 6 × 6 m spacing, reaching 45.39 Mg C ha −1 , which was 23.81% higher than that in the 3 × 8 m spacing stand. Also, a significant variation in carbon storage was also observed among the three clones in the 6 × 6 m spacing ( p < 0.05), and the carbon storage of clone NL-895 was 40.50% higher than that of clone NL-797 in the 6 × 6 m spacing. It is worth noting that carbon storage in the NL-895 plantations in square configurations (5 × 5 m and 6 × 6 m) was higher than in those with rectangular configurations (3 × 8 m, 4.5 × 8 m) at equal or similar planting density (Figure 4).
Based on the values of R 2 , RSOS, RMSE, and AICc for the seven growth models (Table S1) and comparison of the prediction results from the models and measured data (Table S2), the Chapman–Richards model was selected as the best function to predict poplar growth dynamics for each poplar clone at each planting spacing in the present study. According to the established Chapman–Richards model, the curves of tree volume and stand volume growth are fitted to predict the tree growth of different treatments (Figure 5 and Figure 6). After 13 growing seasons, the highest tree volume growth was predicted in the NL-95 plantation with 6 × 6 m spacing, followed by the NL-895 plantation of 6 × 6 m spacing; the lowest growth appeared in the NL-797 plantation of 5 × 5 m spacing (Figure 5A). However, the highest stand volume was estimated in the NL-95 plantation of 6 × 6 m spacing, followed by the NL-95 plantation of 5 × 5 m spacing, while the lowest growth was detected in NL-797 plantation of 6 × 6 m spacing (Figure 5B).
In term of mean annual increment (MAI) and periodic annual increment (PAI) predicted from sample trees, the quantitative maturity ages in the plantations of different treatments ranged from 14 to 17 years (Figure 6), indicating that poplar clones and planting spacings had effects on the quantitative maturity ages. For example, the quantitative maturity age in the NL-895 plantation with 6 × 6 m spacing was 14 years old, while the maturity age was 16 years old in the NL-95 plantation with 6 × 6 m spacing.
Poplar plantations are gaining increased attention as a source of timber production for producing wood products, such as plywood, pulp, and paper, in the world [12,35]. However, plywood, veneer, and fiberboard are the most important outlet for poplar plantations. Previous studies have indicated differences in survival, growth, and productivity between different poplar genotypes (clones) and planting densities under various growing conditions [11,36,37]. It has also been demonstrated that the optimal rotation length of poplar plantations can vary depending on the requirements of the particular target wood product [12,38,39]. Some studies have reported that wood density, microfibril angle, cellulose content, fiber diameter, and the ratio of fiber length to diameter were not only significantly affected by poplar clones and planting densities, but also by the stand ages [39,40]. As a general tendency, basic wood density, fiber length, fiber diameter, and cellulose content showed an increasing tendency along the direction from pith to bark among the growth rings, and a general increasing trend with the increasing height of trees [39,40,41,42]. However, after eight growing seasons, these wood properties reached relative stability [39,40], which means that the technical maturity of poplar plantations is about eight years for plywood and fiberboard. Furthermore, many studies have also shown that the static modulus of elasticity (MOE) and modulus of rupture (MOR) were lower for laminated veneer lumber (LVL) made from juvenile veneers than for LVL made from mature veneers [43,44]. Therefore, adopting a silvicultural regime of longer rotation would improve the mechanical properties of LVL. The possible reasons are these LVL properties are affected by wood density and fiber length [42,45].
The optimal rotation length in poplar plantations should be determined based on technical maturity and quantitative maturity. For example, our results indicate that the quantitative maturity age of clones NL-895 and NL-95 in the 6 × 6 m spacing was 14 years and 16 years, with stand volumes reaching 162.95 m 3 ha −1 and 200.19 m 3 ha −1 , respectively. However, according to the requirement of DBH for plywood timber production ( DBH ≥ 26.0 cm) [46], only the clone NL-95 in the 6 × 6 m spacing was observed approximately to achieve the standard of technical maturity for the plywood target. Considering the quantitative maturity age and technical maturity age, a longer rotation age of poplar plantations was observed at the study site when compared to the results from other studies. Huang et al. [38] observed that the rotation age was 11 years old in 5 × 6 m planting spacing, and Tang [47] reported that the quantitative mature age was 13 years old in planting spacing of 4 × 6 m. The reasons probably are due to the interplay between genotypes and site conditions, which largely affects the growth rate of poplar plantations [9,15]. In addition, Tun et al. [22] suggested that better stem roundness was found in the square configurations. Overall, we suggest that the clone NL-95 with 6 × 6 m spacing would be selected for high-value, larger diameter timber production, and its optimal rotation length for plywood timber should be about 20 years at the research site. Notably, the economic maturity age, as an important factor to decide the optimal rotation age, should be carefully considered in the future research.
Forest growth plays a key role in the carbon balance of terrestrial ecosystems [48,49]. However, carbon concentration is generally assumed to be constant in carbon storage assessments, and the variation in carbon concentration between the tree components was neglected in a large-scale study [50]. Our results confirmed that the carbon concentration of tree components was significant different, in the order of stem > branch > leaf. However, the carbon concentration showed less correlation with poplar clones and planting spacings (Table 3), which is in agreement with the results from [51,52]. However, the carbon concentrations from the present study are lower than those from other poplar plantations [51,53], where the leaf carbon concentration of the poplar was over 42.9%. The possible reason is that poplar genotype, site condition, geographical area, stand age, and sampling time would create this difference in carbon content. However, some studies have indicated that plant carbon concentration was in the range of 24.95–55.44%, with an average of 43.63%, while the average carbon concentration for different components was flower (48.52%) > fruit (47.19%) > branch (45.42) > stem (44.48%) > leaf (43.36%) > root (42.88%) [54,55]. Furthermore, the average carbon concentration was in the order of high latitude area (50.30%) > low latitude area (45.30%) > middle latitude area (39.68%) [54]. Our research site was located in the middle latitude area, and carbon concentrations were within the range. Thereby, the biomass partitioning of poplar trees can alter carbon storage in the poplar plantations to some extent, and play an important role in forest ecosystem carbon cycling [49]. Our results (Figure 2) agree with the well-known fact that growth performance and biomass partitioning of poplar plantations are affected by clones and planting spacings [9,15,22]. For example, poplar plantations of three clones at low density showed higher leaves and branches biomass, probably due to the light availability, which likely stimulated growth and production of branches and leaves [56]. However, the branch biomass for all tested clones was the highest in the middle layer, followed by lower and upper layers, while the leaf biomass was concentrated in the middle and upper layers (Figure 3), which is beneficial for improving solar radiation interception efficiency under the inter-tree competition [57].
Aboveground carbon storage of poplar plantations was mainly determined by productivity and biomass partitioning. The present study shows that the DBH , H , tree volume, and aboveground biomass of the three clones for a single tree was enhanced as planting spacing increased, and the biomass in the NL-895 plantations of square configurations (5 × 5 m and 6 × 6 m) was higher than those with rectangular configurations (3.0 × 8.0 m and 4.5 × 8.0 m) at equal or similar planting densities. However, both stand volume and total aboveground biomass per area for clone NL-797 were higher in the 5 × 5 m spacing stand than that in the 6 × 6 m spacing, contrary to that of clones NL-895 and NL-95. This presumably is due to a lower growth rate in clone NL-797 compared to clones NL-895 and NL-95, as well as the stem number per hectare being the main driver of aboveground biomass accumulated at the measured period.
Generally, the variation of carbon storage in clones NL-895, NL-95, and NL-797 was consistent with the total aboveground biomass (Figure 2 and Figure 4). In the current research, stems and branches accounted for 84.6% and 13.84% of the total aboveground biomass, respectively, which are congruent with previous reports that most biomass accumulates in stem and branches. Additionally, in different planting spacings, the proportion of leaf and branch biomass decreases with forest age, competition, and resource availability [34,51]. This means, thus, that rotation length affects the carbon storage in the plantations, and that the stems are the main component of aboveground carbon storage with regard to prolonging the rotation. Based on the results of PAI in the present study, we speculate that the carbon storage of poplar plantations would still increase after reaching the quantitative maturity age (Figure 6), and suggest that the optimal rotation length for carbon sequestration should be longer than that of the quantitative maturity age.
In conclusion, poplar clones and planting spacings significantly affected the growth, biomass accumulation, biomass partitioning, and aboveground carbon storage in the poplar plantations, while the NL-895 plantations with the square configurations produced higher biomass than the plantations with the rectangular configurations at equal or similar planting densities. Poplar clones and planting spacings also significantly affected the vertical biomass distribution in the canopy. More biomass was partitioned to canopy biomass (leaves and branches) in the plantations with wide spacing when compared to the narrow ones. However, the greatest biomass of the branches was observed in the middle layer, whereas the biomass of the leaves was concentrated in the middle and upper layers. Based on the growth prediction of the established Chapman–Richards model, the quantitative maturity ages of stand volume varied among the investigating plantations, ranging from 14 to 17 years old. Our results suggest that selecting clones NL-895 and NL-95 with 6 × 6 m spacing would be recommended for future poplar silviculture of larger diameter timber production, and the optimal rotation length for plywood timber and carbon sequestration should be about 20 years at similar sites.
The following are available online at https://www.mdpi.com/1999-4907/11/8/842/s1, Table S1: Parameters of poplar DBH , H , and tree volume models with different treatments; Table S2: Comparison of models and measured data of poplar tree volume for smoothed data set, X 1, X 2, and X 3.
S.F. and Y.T. conceived and designed this experiment; Y.Z., S.D., Y.L., and W.S. conducted field investigations and laboratory work; Y.Z. conducted data analysis and wrote the initial draft of the manuscript, and S.F. revised the draft. All authors contributed to the revising of the final version of the manuscript. The authors approved the final version for publication, and agree to be held accountable for the content therein. All authors have read and agreed to the published version of the manuscript.
The study described in this paper was supported financially by the National Key Research and Development Project (2016YFD0600402). We thank Linlin Wang and Jian Qin for assistance with the carbon–nitrogen analyzer, and Guangzhen Qin and Xiliang Yue for their assistance with the laboratory work.
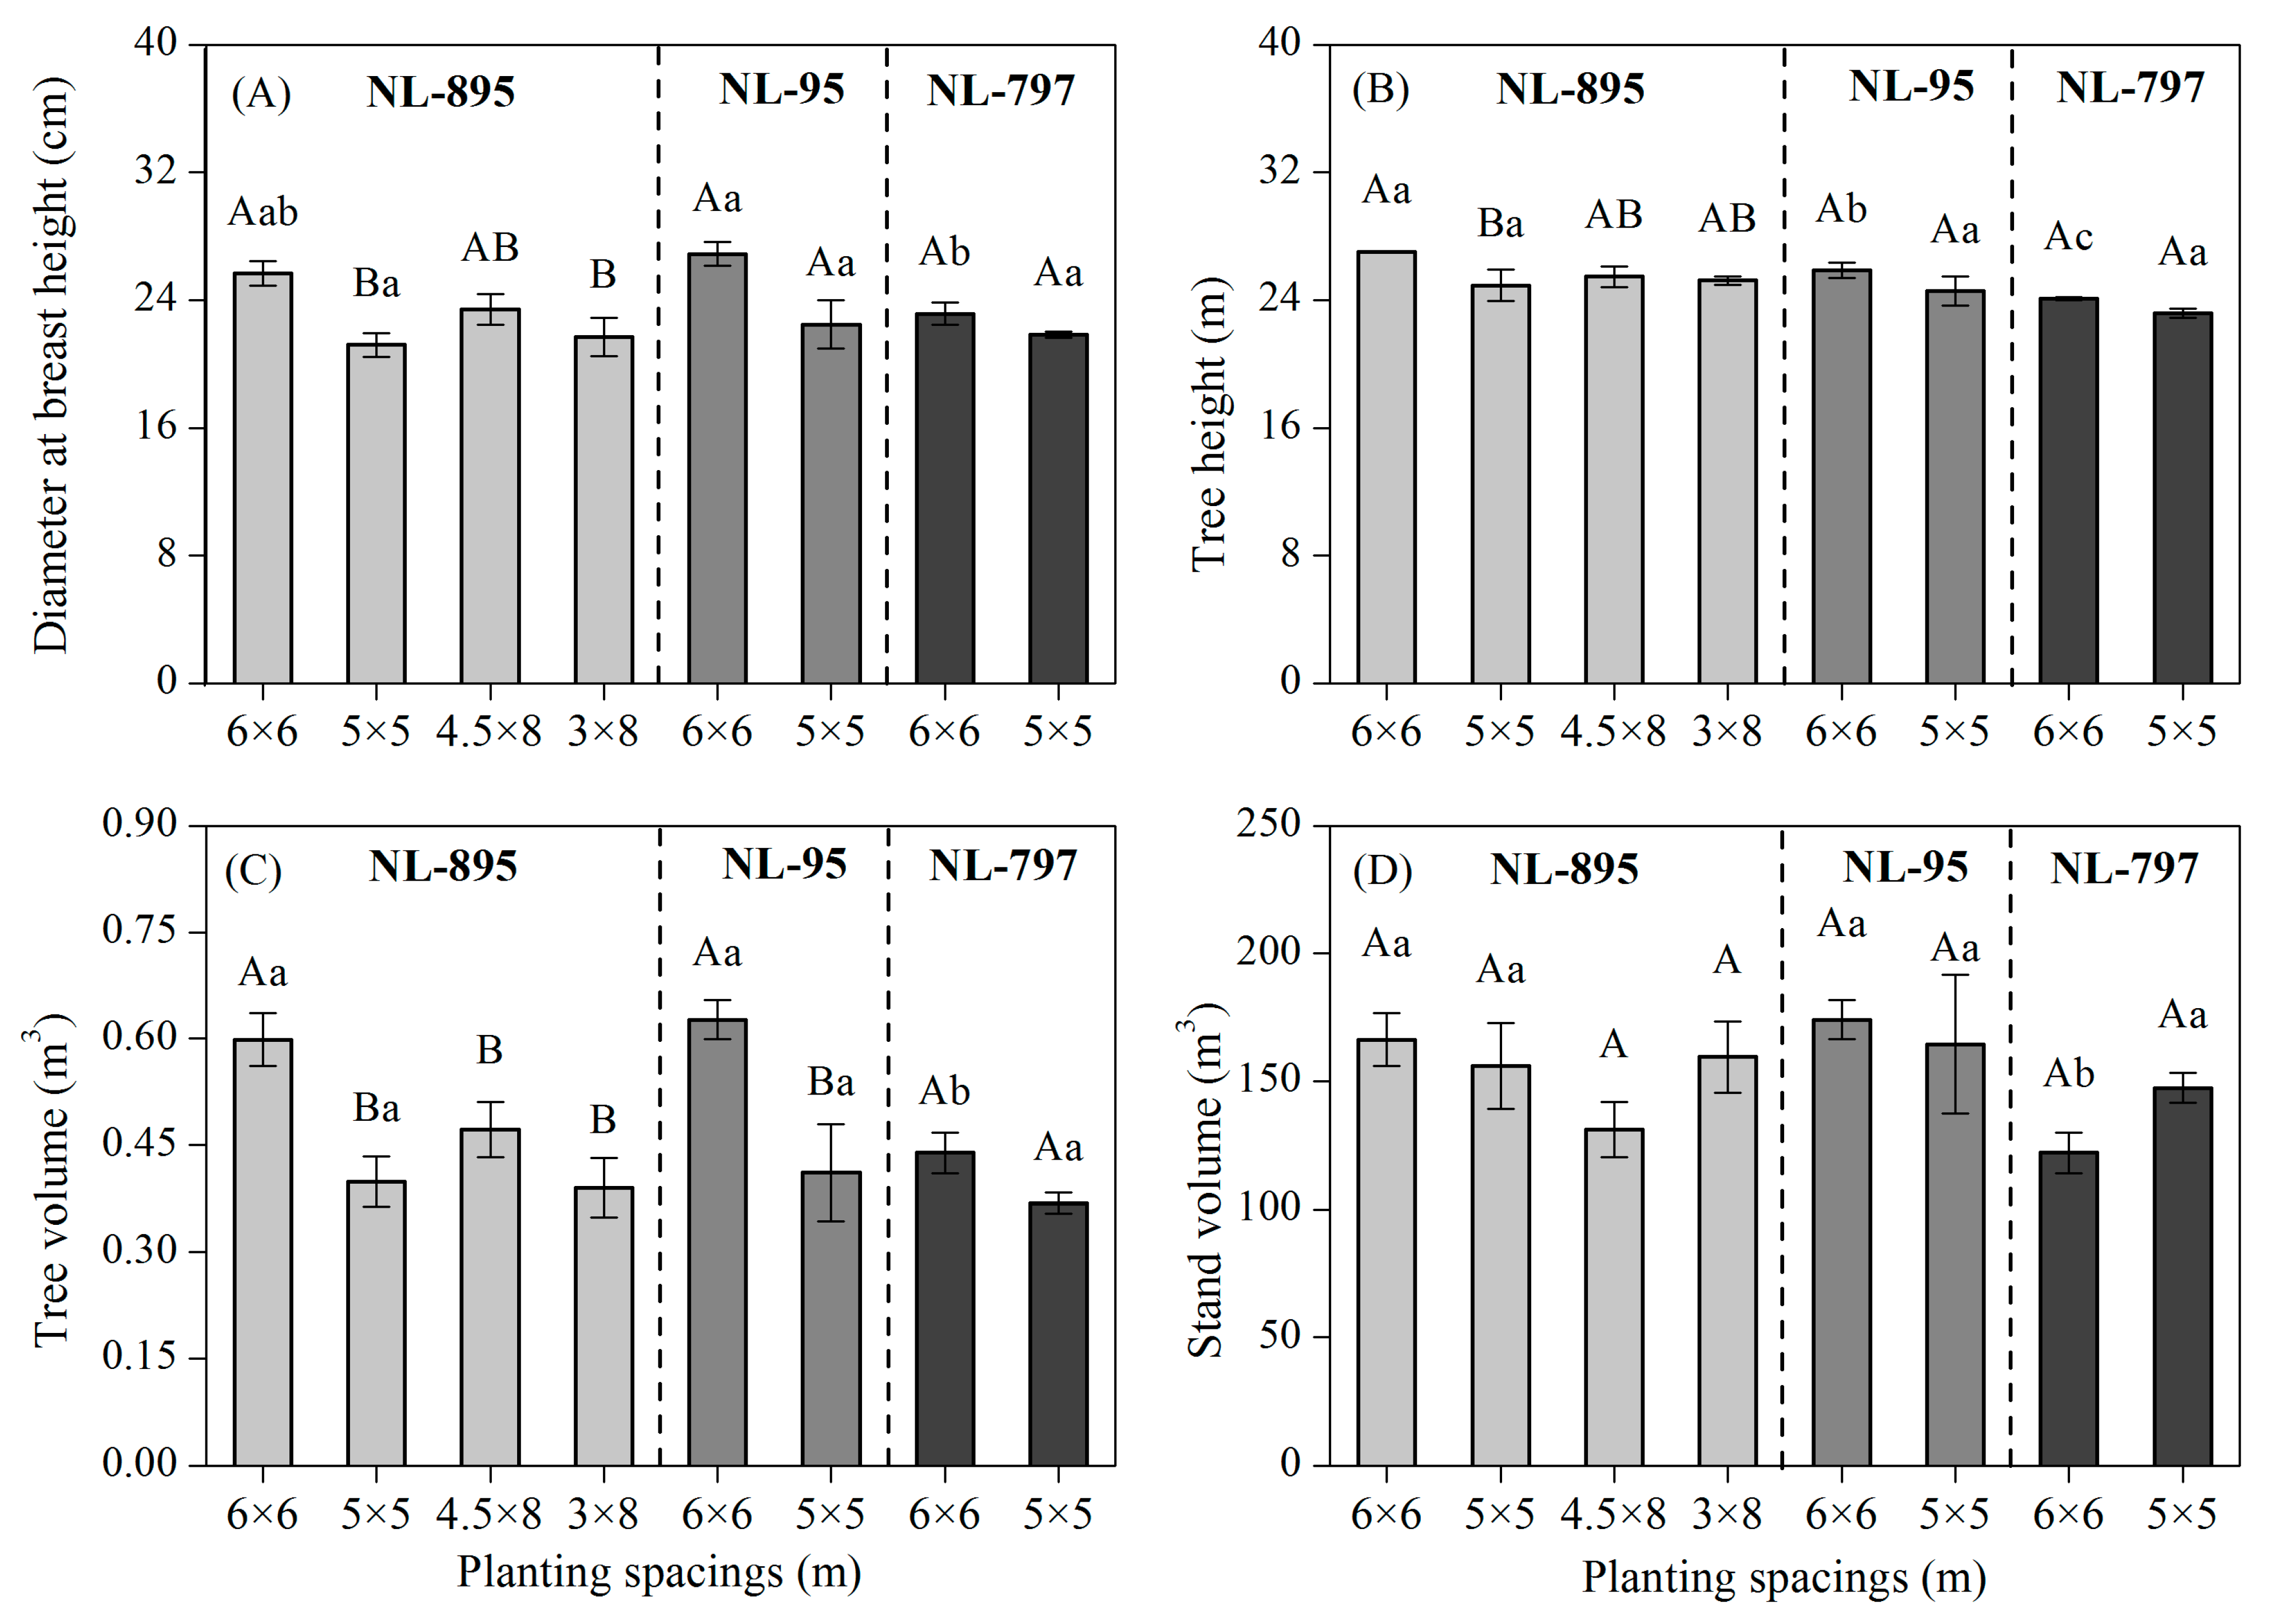
Figure 1. Effects of poplar clones and planting spacings on diameter at breast height ( DBH , A), tree height (B), tree volume (C), and stand volume (D) in 13-year old poplar plantations. Different capital letters indicate significant differences ( p < 0.05) by Tukey test between planting spacings in each clone, while different small letters indicate significant differences ( p < 0.05) by Tukey test between clones within each planting spacing. The error bars indicate the standard error.
Figure 1. Effects of poplar clones and planting spacings on diameter at breast height ( DBH , A), tree height (B), tree volume (C), and stand volume (D) in 13-year old poplar plantations. Different capital letters indicate significant differences ( p < 0.05) by Tukey test between planting spacings in each clone, while different small letters indicate significant differences ( p < 0.05) by Tukey test between clones within each planting spacing. The error bars indicate the standard error.
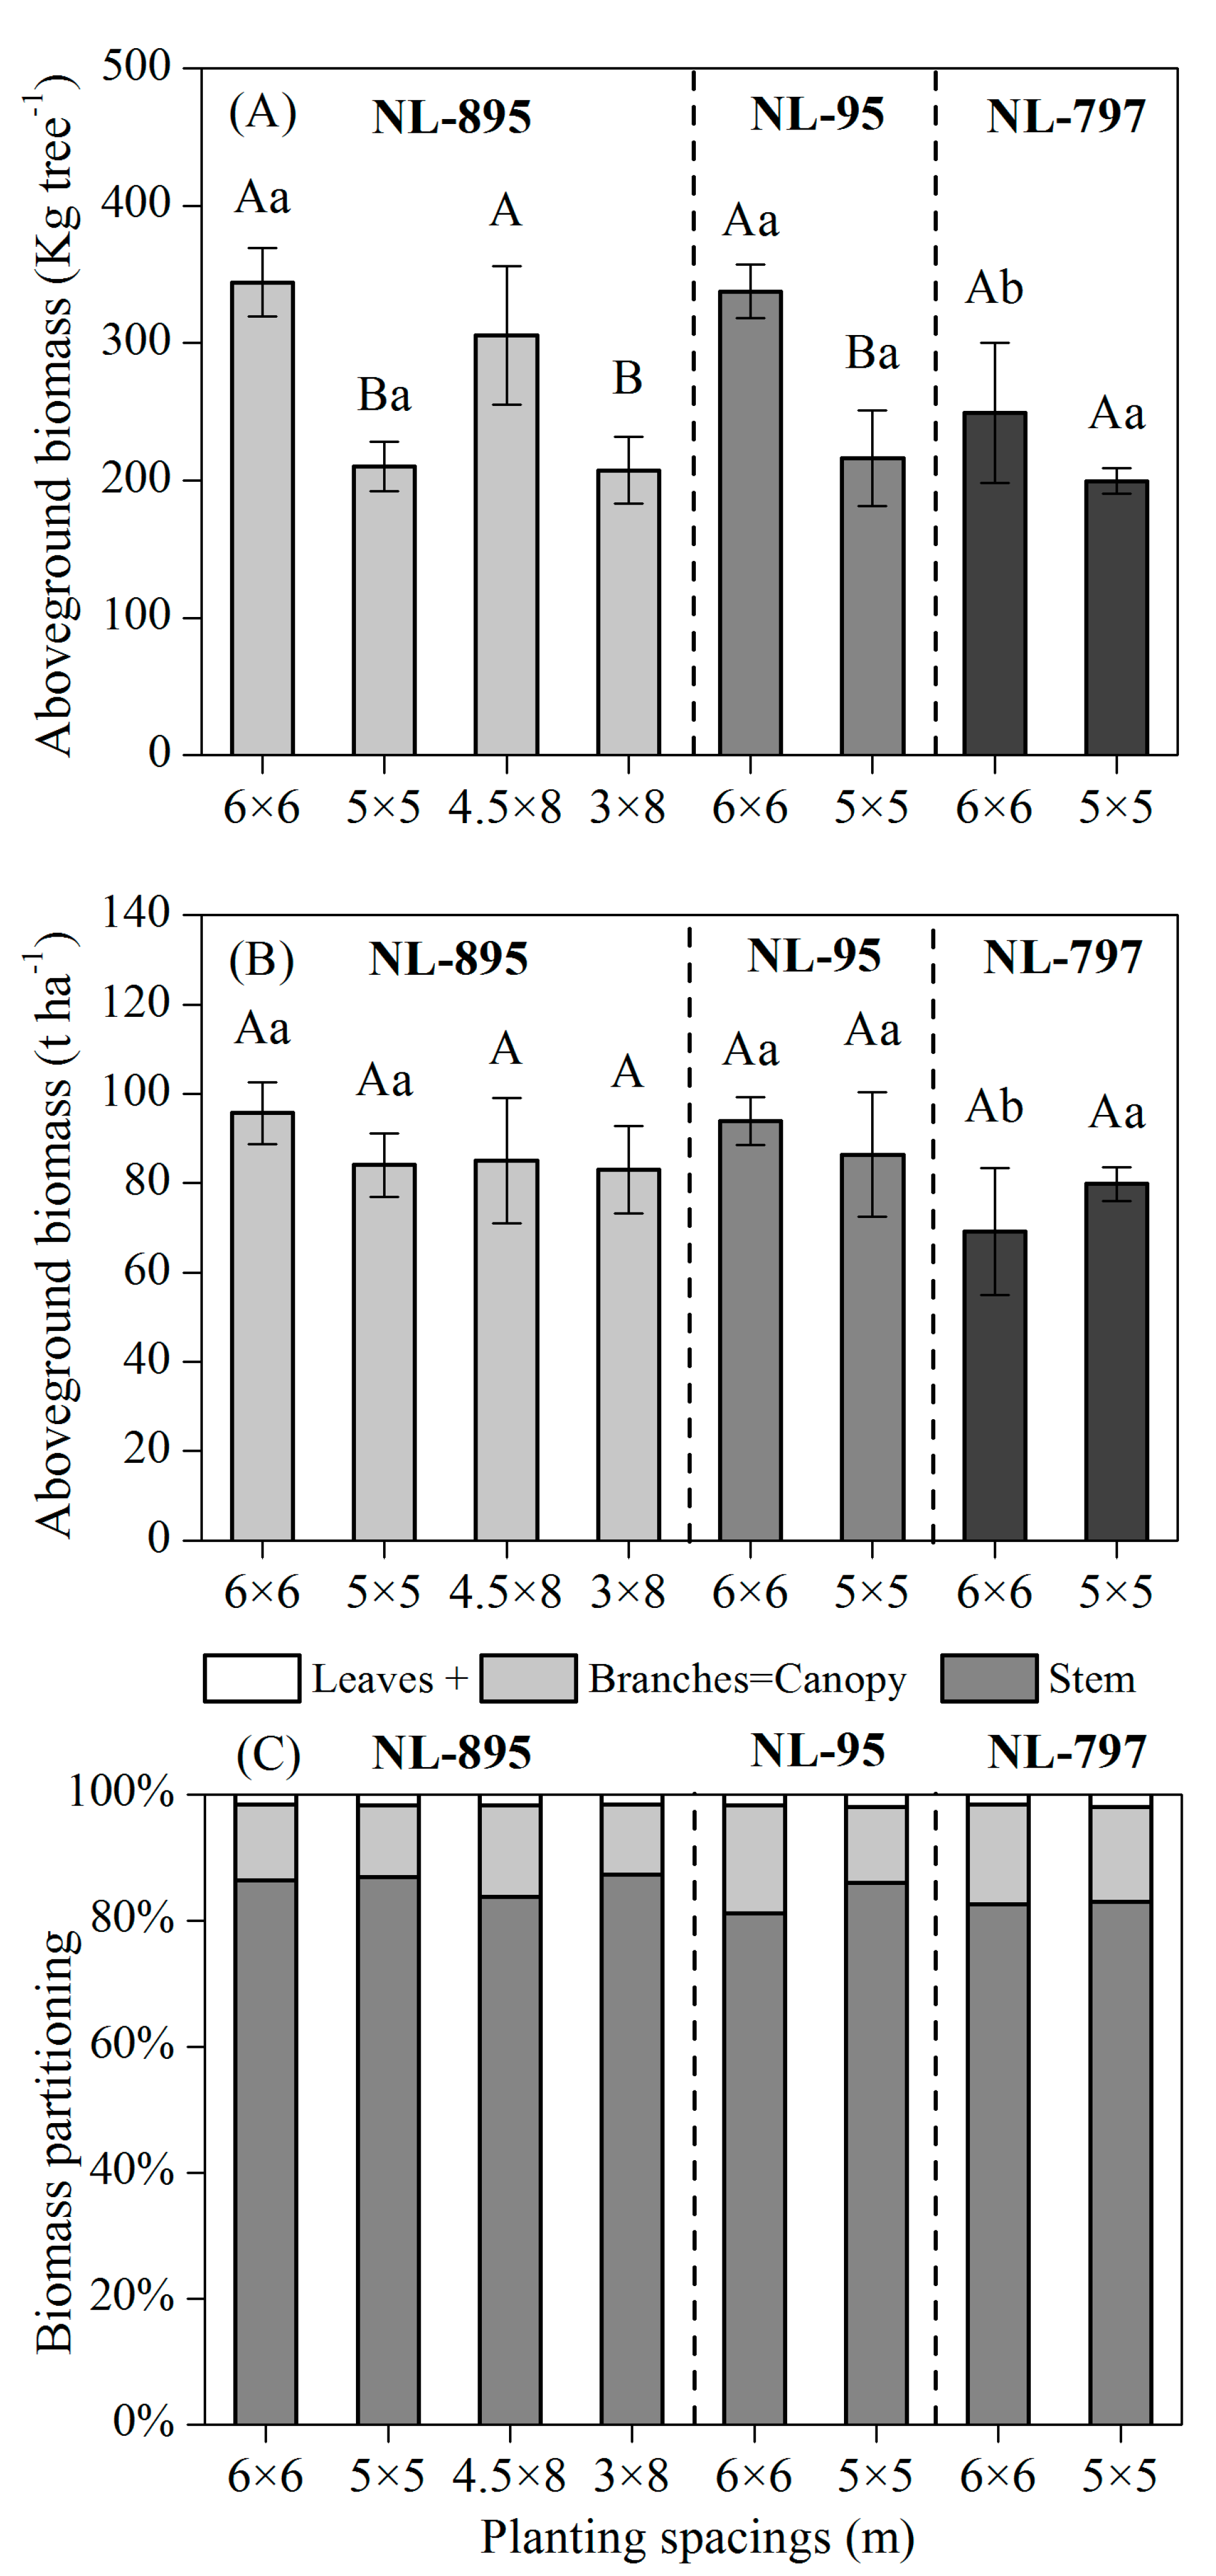
Figure 2. Effects of poplar clones and planting spacings on aboveground biomass of per sample tree (A) and per hectare (B) in 13-year-old poplar plantations. Different capital letters indicate significant differences ( p < 0.05) by Tukey test between planting spacings for each clone, and different small letters indicate significant differences ( p < 0.05) by Tukey test between clones within each planting spacing. Last is the biomass partitioning of poplar in eight treatments (C). The error bars indicate the standard error.
Figure 2. Effects of poplar clones and planting spacings on aboveground biomass of per sample tree (A) and per hectare (B) in 13-year-old poplar plantations. Different capital letters indicate significant differences ( p < 0.05) by Tukey test between planting spacings for each clone, and different small letters indicate significant differences ( p < 0.05) by Tukey test between clones within each planting spacing. Last is the biomass partitioning of poplar in eight treatments (C). The error bars indicate the standard error.
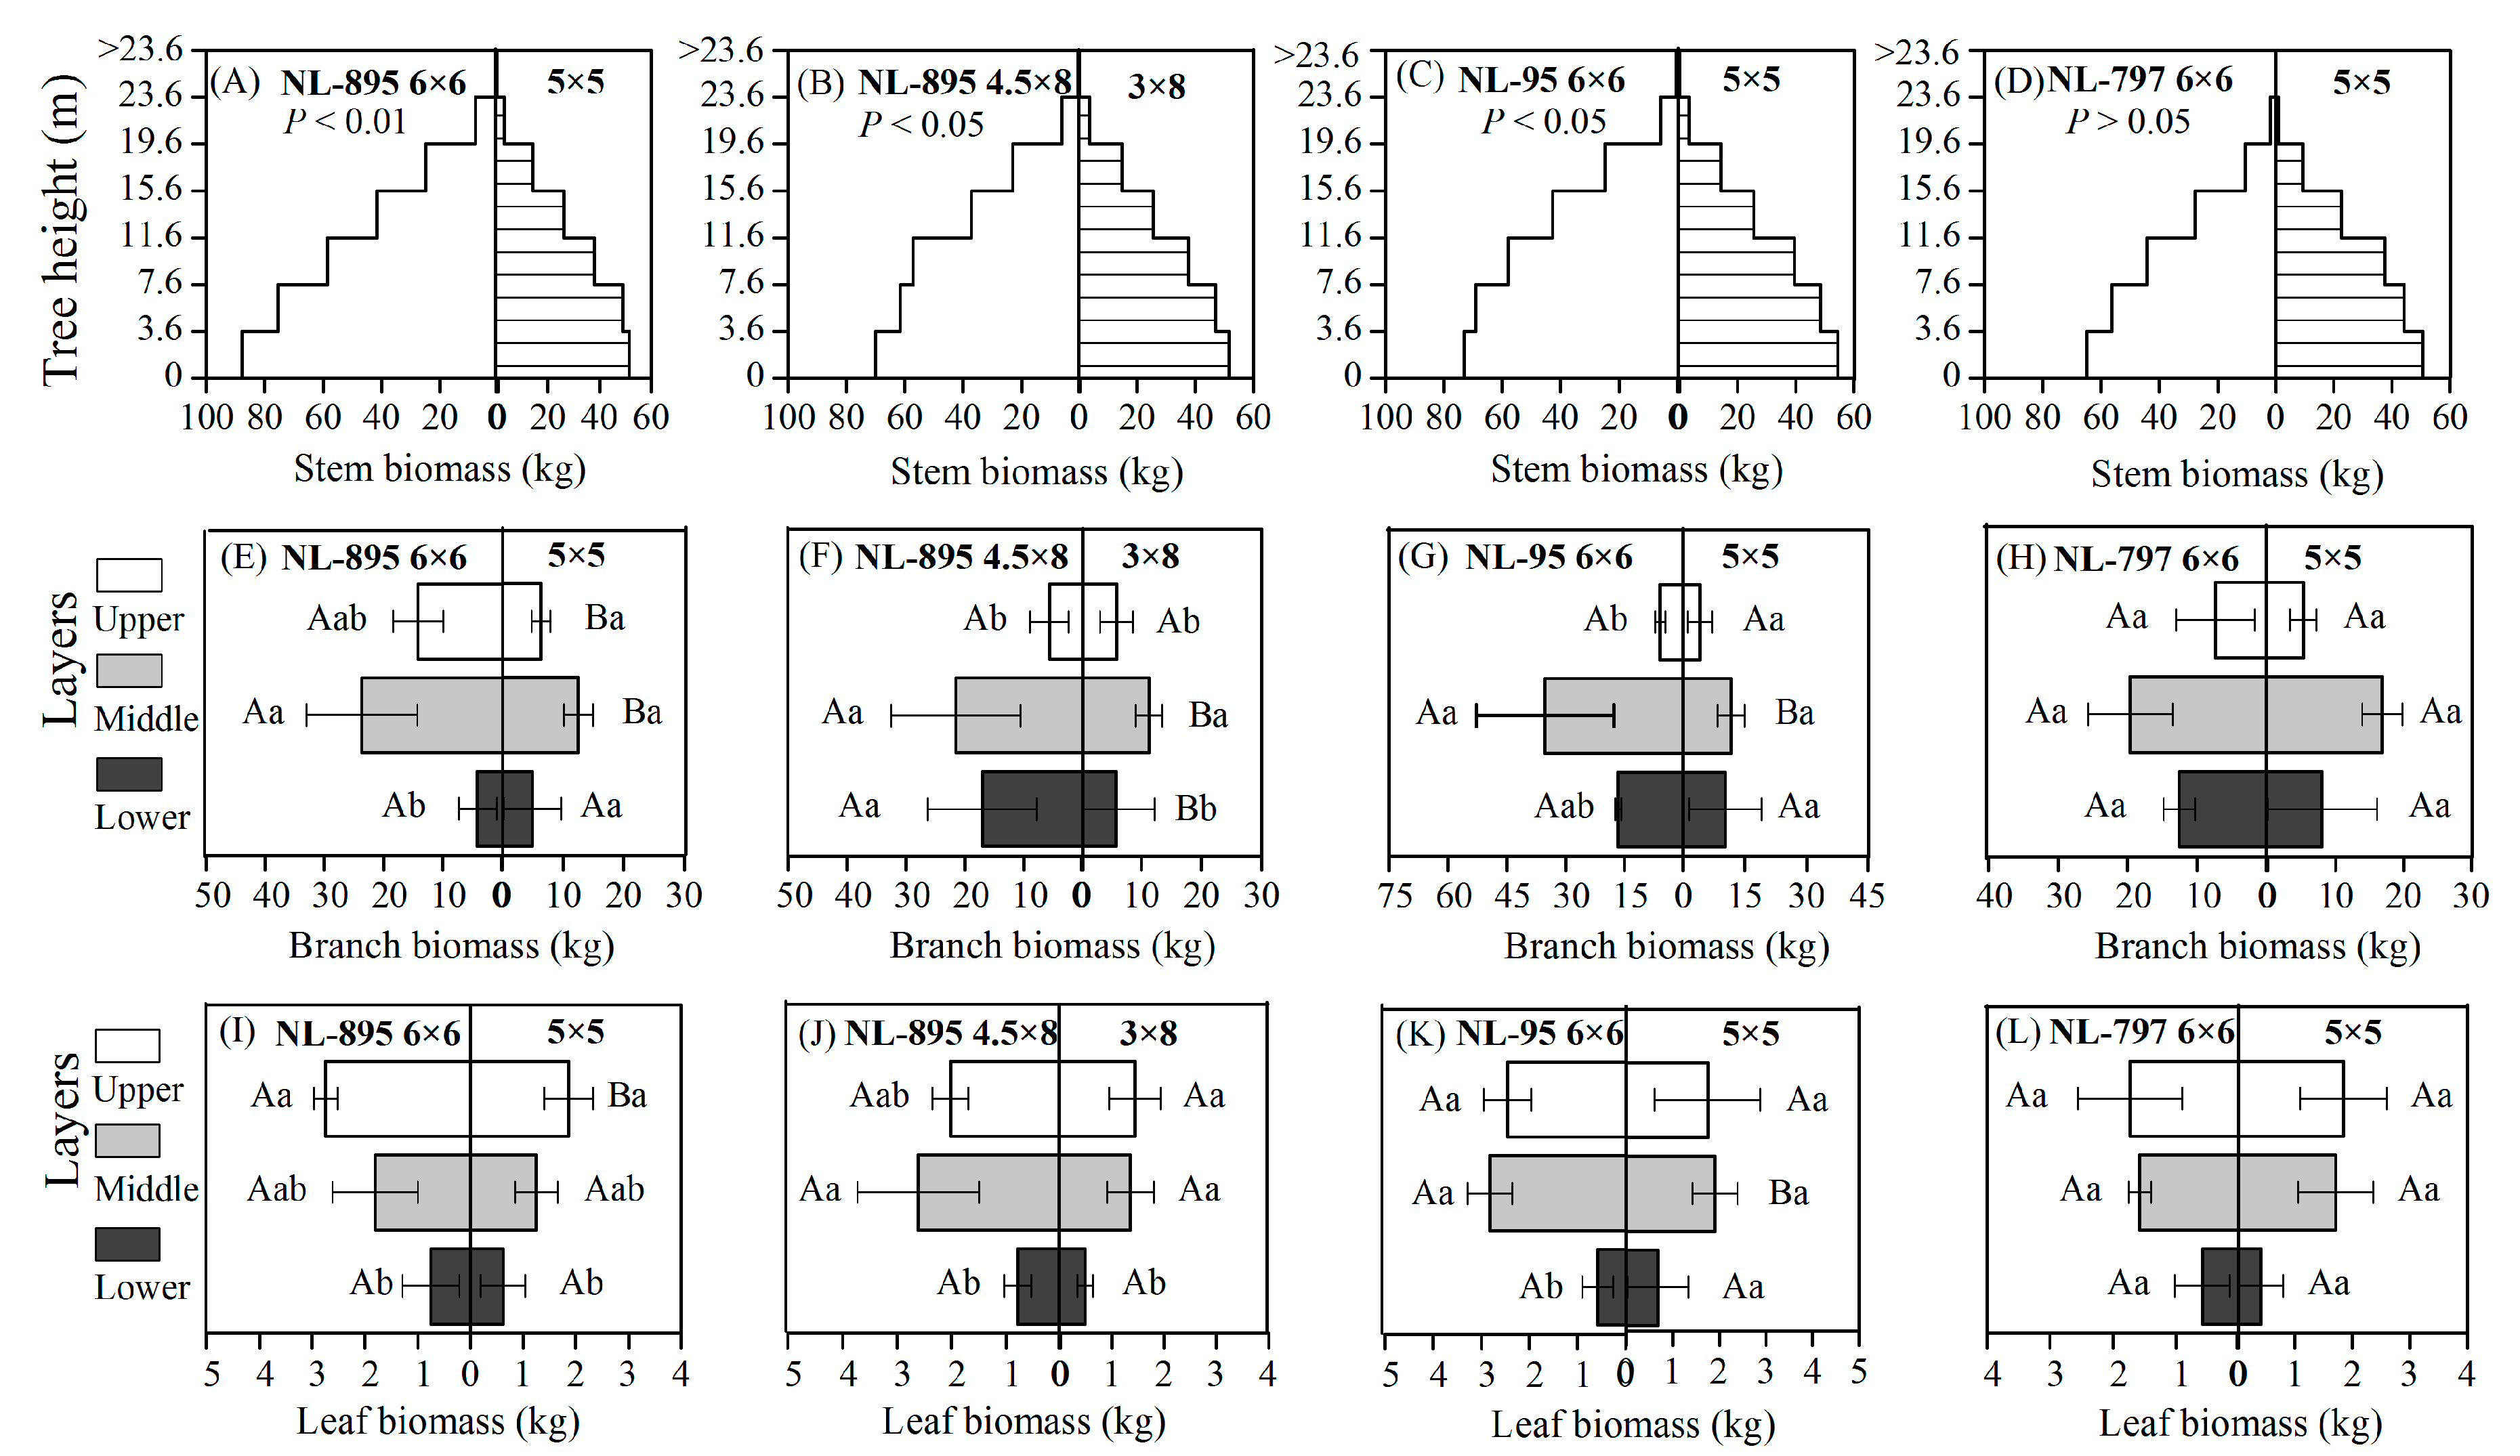
Figure 3. Effects of poplar clones and planting spacings on the vertical biomass distribution in stem (A–D), branches (E–H), and leaves (I–L) for the 13-year-old trees. Different capital letters indicate significant differences ( p < 0.05) by Tukey test between the two spacing treatments at the same layer. Different small letters indicate significant differences ( p < 0.05) by Tukey test between the lower, middle, and upper layers of crown.
Figure 3. Effects of poplar clones and planting spacings on the vertical biomass distribution in stem (A–D), branches (E–H), and leaves (I–L) for the 13-year-old trees. Different capital letters indicate significant differences ( p < 0.05) by Tukey test between the two spacing treatments at the same layer. Different small letters indicate significant differences ( p < 0.05) by Tukey test between the lower, middle, and upper layers of crown.
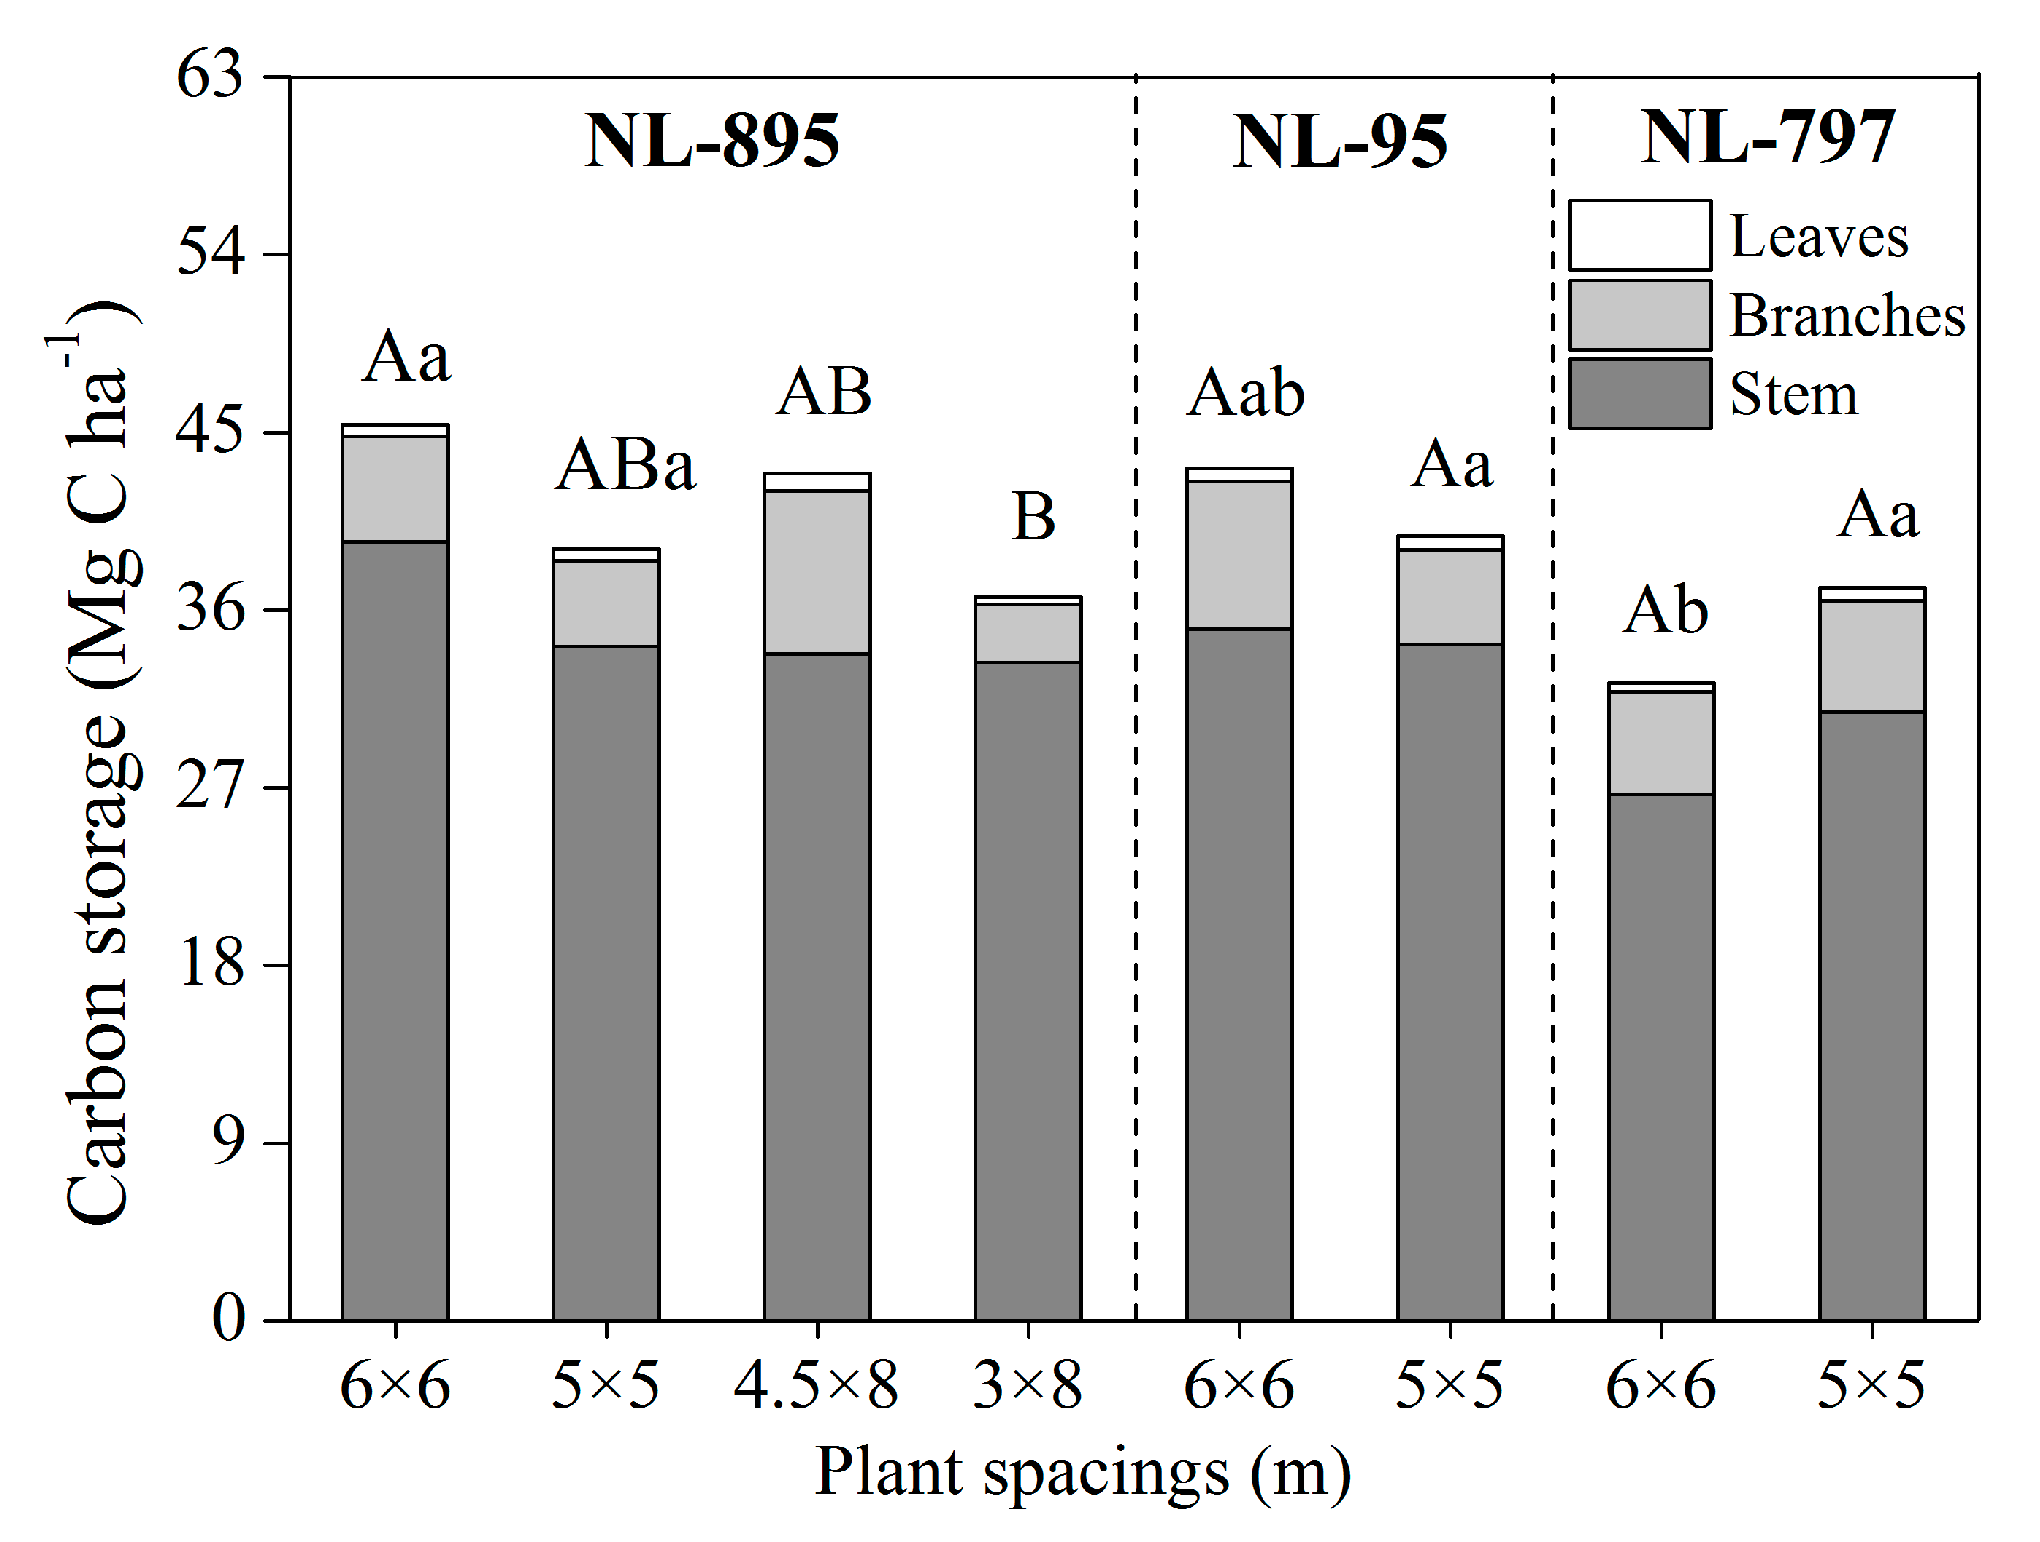
Figure 4. Effects of poplar clones and planting spacings on aboveground carbon storage in 13-year-old poplar plantations. Different capital letters indicate significant differences ( p < 0.05) by Tukey test between spacings for each clone, while different small letters indicate significant differences ( p < 0.05) by Tukey test between clones within each planting spacing.
Figure 4. Effects of poplar clones and planting spacings on aboveground carbon storage in 13-year-old poplar plantations. Different capital letters indicate significant differences ( p < 0.05) by Tukey test between spacings for each clone, while different small letters indicate significant differences ( p < 0.05) by Tukey test between clones within each planting spacing.
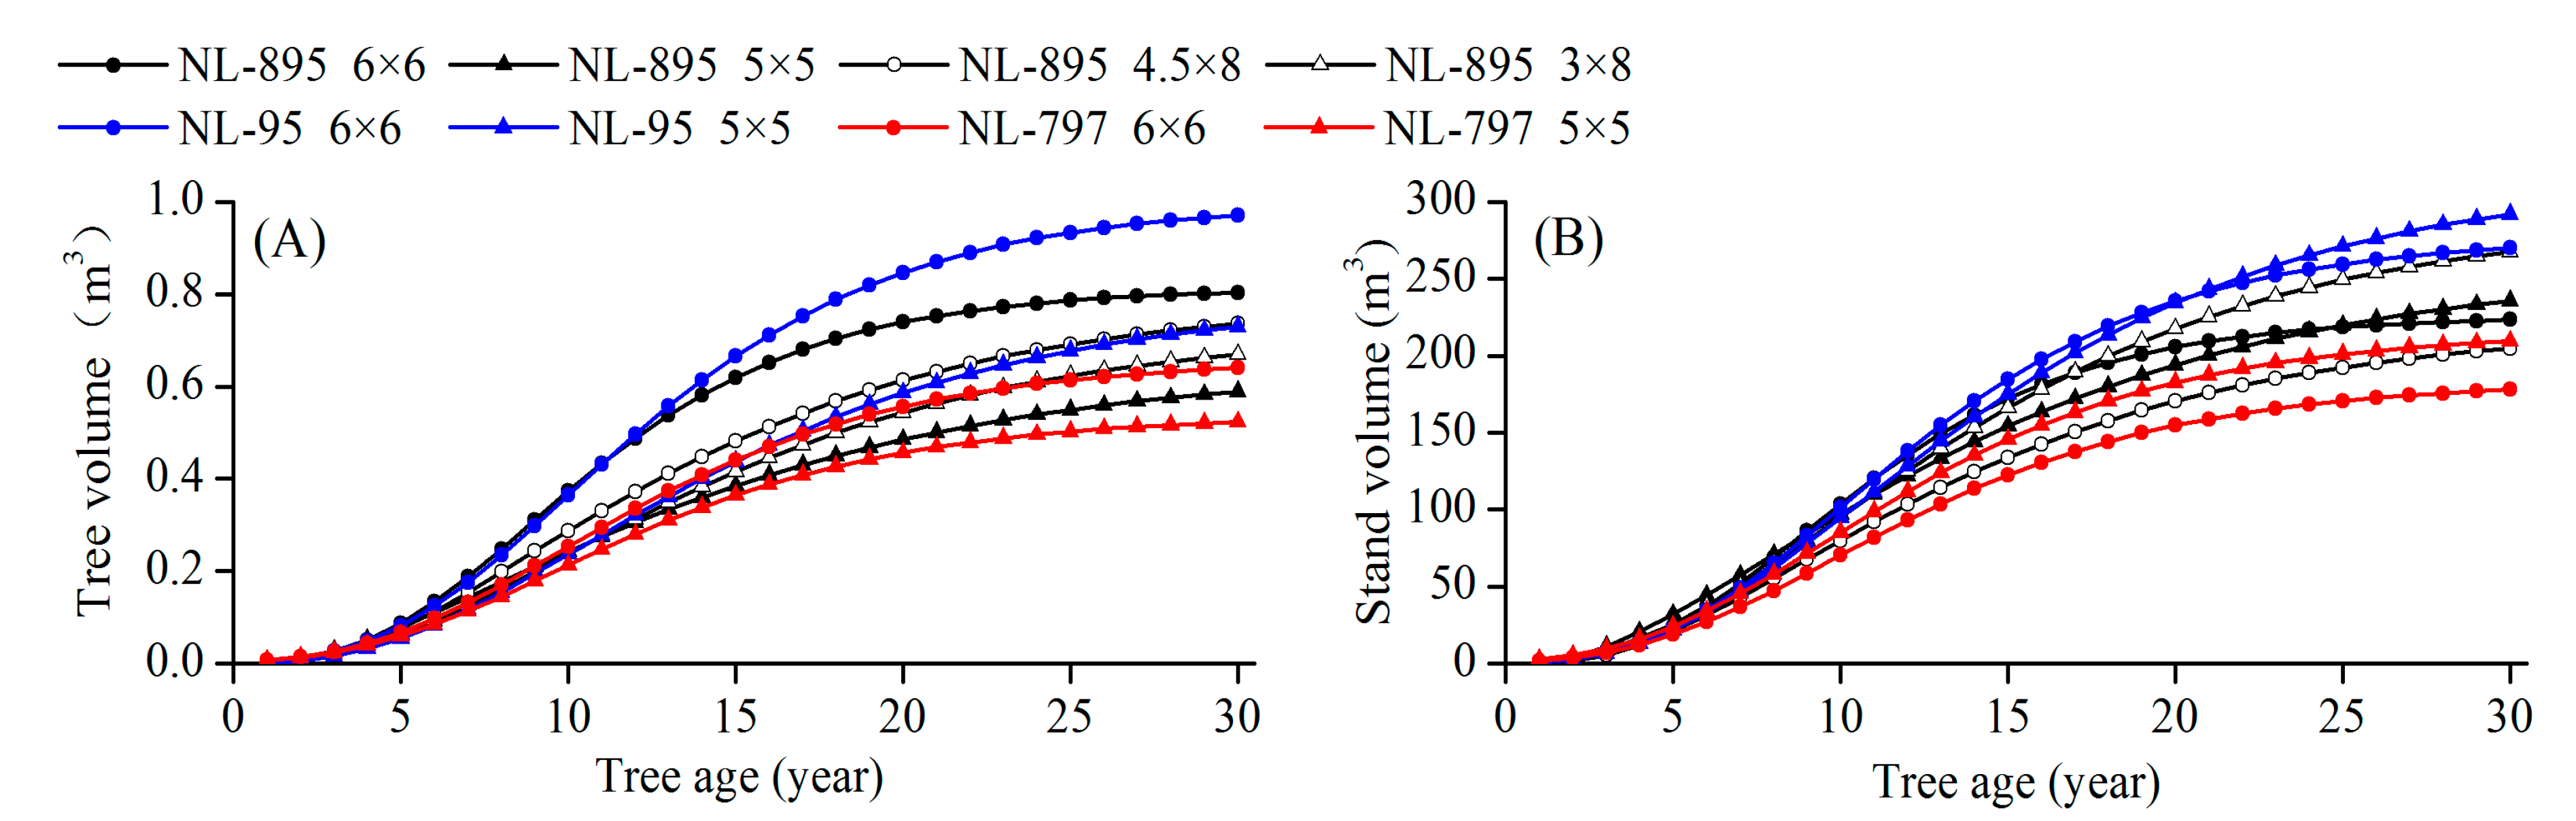
Figure 5. Predictions of tree volume (A) and stand volume (B) in different treatments of poplar clones and planting spacings by the fitted Chapman–Richards model (up to 30 years).
Figure 5. Predictions of tree volume (A) and stand volume (B) in different treatments of poplar clones and planting spacings by the fitted Chapman–Richards model (up to 30 years).
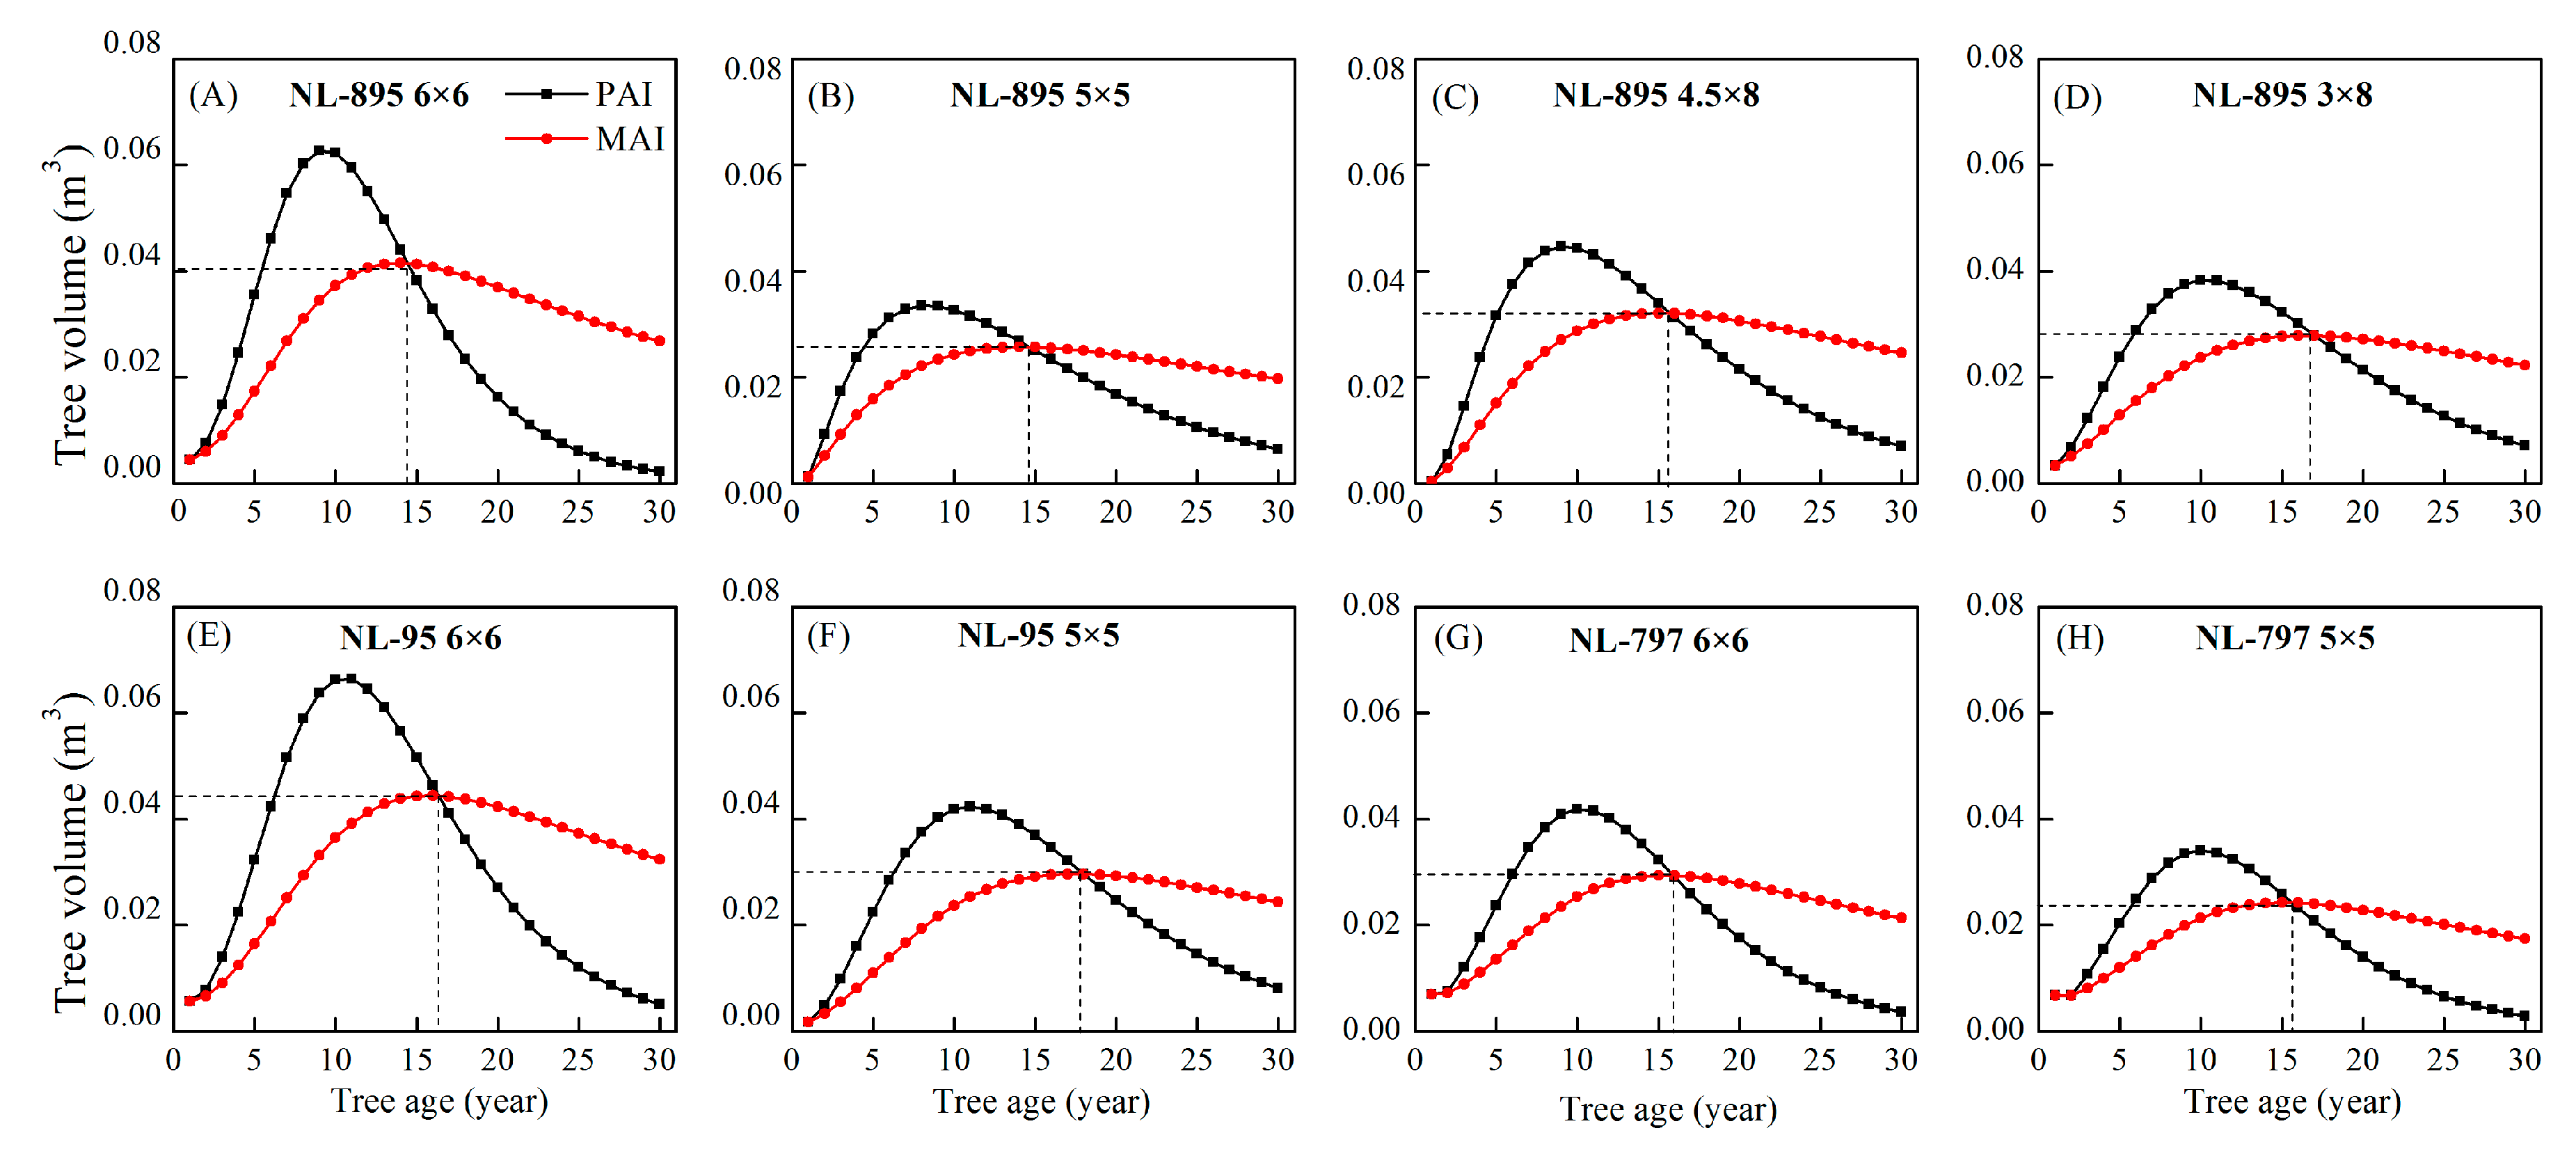
Figure 6. The mean annual increment (MAI) and periodic annual increment (PAI) of sample trees of four planting spacings of NL-895 (A–D) and two planting spacings of NL-95 (E,F) and NL-797 (G,H), which were calculated using Chapman–Richards model prediction data (up to 30 years).
Figure 6. The mean annual increment (MAI) and periodic annual increment (PAI) of sample trees of four planting spacings of NL-895 (A–D) and two planting spacings of NL-95 (E,F) and NL-797 (G,H), which were calculated using Chapman–Richards model prediction data (up to 30 years).
Table 2. F -values of two-way ANOVA for effects of different clone and planting spacing on poplar growth indicators at the stand age of 13 years.
Table 2. F -values of two-way ANOVA for effects of different clone and planting spacing on poplar growth indicators at the stand age of 13 years.
| Index | Treatment | df | Stand Age (years) | ||||||||||||
|---|---|---|---|---|---|---|---|---|---|---|---|---|---|---|---|
| 1 | 2 | 3 | 4 | 5 | 6 | 7 | 8 | 9 | 10 | 11 | 12 | 13 | |||
| Diameter | Clone (C) | 2 | 0.35 | 0.11 | 0.34 | 0.58 | 0.72 | 1.37 | 2.40 | 2.72 | 3.25 | 3.55 | 3.95 * | 4.12 * | 3.79 * |
| At breast height | Spacing (S) | 3 | 0.86 | 0.76 | 0.74 | 0.54 | 1.25 | 2.75 | 3.82 * | 4.73 ** | 5.89 ** | 7.15 ** | 8.65 ** | 9.17 ** | 8.23 ** |
| C × S | 2 | 0.76 | 1.32 | 0.56 | 0.19 | 0.79 | 1.09 | 1.01 | 1.28 | 1.34 | 1.79 | 2.30 | 2.54 | 2.56 | |
| Tree height | C | 2 | 0.27 | 0.82 | 0.79 | 0.48 | 1.27 | 0.79 | 0.70 | 1.32 | 1.60 | 5.85 * | 13.41 * | 9.93 * | 8.89 * |
| S | 3 | 0.57 | 0.15 | 0.41 | 0.64 | 1.75 | 3.14 | 1.33 | 0.64 | 0.74 | 3.18 | 3.16 | 3.09 | 3.66 * | |
| C × S | 2 | 0.27 | 0.85 | 0.42 | 1.30 | 0.84 | 0.97 | 0.77 | 0.67 | 0.21 | 0.67 | 2.10 | 0.96 | 0.55 | |
| Tree volume | C | 2 | 2.04 | 0.09 | 0.26 | 0.49 | 1.19 | 2.36 | 4.08 * | 4.92 * | 5.34 * | 6.26 * | 7.21 * | 7.10 * | 6.33 * |
| S | 3 | 2.77 | 0.51 | 0.44 | 0.47 | 1.28 | 3.25 * | 4.87 * | 6.81 * | 8.74 * | 10.72 * | 12.83 * | 12.77 * | 11.229 * | |
| C × S | 2 | 2.05 | 1.18 | 0.90 | 0.46 | 0.55 | 0.82 | 0.92 | 1.30 | 1.49 | 2.04 | 2.68 | 2.80 | 2.73 | |
Table 3. The average carbon concentrations of different biomass components from the poplar plantations with various treatments (%).
Table 3. The average carbon concentrations of different biomass components from the poplar plantations with various treatments (%).
| Poplar Clone | Planting Spacing (m) | Biomass Components | ||
|---|---|---|---|---|
| Leaf | Branch | Stem | ||
| NL-895 | 6 × 6 | 39.79 ± 0.14 Cb | 46.11 ± 0.28 Ba | 47.76 ± 0.25 Aa |
| 5 × 5 | 39.85 ± 0.23 Bb | 46.08 ± 0.29 Aa | 46.69 ± 0.26 Aa | |
| 4.5 × 8 | 40.11 ± 0.41 B | 46.01 ± 0.25 A | 46.88 ± 0.09 A | |
| 3 × 8 | 40.92 ± 0.58 B | 46.41 ± 0.39 A | 46.66 ± 0.27 A | |
| NL-95 | 6 × 6 | 41.23 ± 0.91 Bab | 46.15 ± 0.4 Aa | 46.01 ± 0.21 Ab |
| 5 × 5 | 41.11 ± 0.64 Bab | 46.4 ± 0.19 Aa | 46.09 ± 0.08 Aa | |
| NL-797 | 6 × 6 | 42.35 ± 0.4 Ba | 46.88 ± 0.18 Aa | 46.66 ± 0.09 Ab |
| 5 × 5 | 42.29 ± 0.31 Ba | 46.67 ± 0.25 Aa | 46.56 ± 0.21 Aa | |
Note: different capital letters indicate significant differences ( p < 0.05) between biomass components in each treatment, while different small letters indicate significant differences ( p < 0.05) between clones for each same planting spacing.
© 2020 by the authors. Licensee MDPI, Basel, Switzerland. This article is an open access article distributed under the terms and conditions of the Creative Commons Attribution (CC BY) license (http://creativecommons.org/licenses/by/4.0/).
Zhang, Y.; Tian, Y.; Ding, S.; Lv, Y.; Samjhana, W.; Fang, S. Growth, Carbon Storage, and Optimal Rotation in Poplar Plantations: A Case Study on Clone and Planting Spacing Effects. Forests 2020, 11, 842. https://doi.org/10.3390/f11080842
AMA StyleZhang Y, Tian Y, Ding S, Lv Y, Samjhana W, Fang S. Growth, Carbon Storage, and Optimal Rotation in Poplar Plantations: A Case Study on Clone and Planting Spacing Effects. Forests. 2020; 11(8):842. https://doi.org/10.3390/f11080842
Chicago/Turabian Style
Zhang, Yanhua, Ye Tian, Sihui Ding, Yi Lv, Wagle Samjhana, and Shengzuo Fang. 2020. "Growth, Carbon Storage, and Optimal Rotation in Poplar Plantations: A Case Study on Clone and Planting Spacing Effects" Forests 11, no. 8: 842. https://doi.org/10.3390/f11080842
Note that from the first issue of 2016, this journal uses article numbers instead of page numbers. See further details here.